Usage
The Usage page reports how your GPUStack resources are consumed over time — LLM tokens, GPU/CPU instance runtime, and storage capacity — so you can track adoption, attribute consumption to users, and reason about cost.
Accessing the Usage Page
- Navigate to the
Usagepage from the left navigation (the bar-chart icon). - Select a tab —
Summary,Tokens,GPU Instances,Storage, orResource Events. - Set the
date range(and any other filters) to scope the report.
The tabs are:
- Summary — a one-glance overview of tokens, compute, and storage.
- Tokens — LLM token consumption, broken down by model / user / API key.
- GPU Instances — GPU/CPU instance runtime, broken down by instance type / instance / user.
- Storage — storage capacity usage, broken down by storage / user.
- Resource Events — the lifecycle audit log behind the compute/storage numbers.
What gets metered
| Resource | Metered while… | Bucket granularity |
|---|---|---|
| Tokens | An inference request is served through the gateway. | Daily |
| GPU/CPU instances | The instance is in a running (metered) phase. A Stopped or deleted instance does not accrue. | Hourly |
| Storage | From creation to deletion — capacity is metered regardless of whether it is attached. | Hourly |
Visibility
GPUStack has two roles — Admin and User (see User Management):
- Admin — can view usage across all users, and narrow the view with the Filter by user control.
- User — can view only their own usage; per-user breakdowns are not available.
Common controls
Every tab (except Resource Events, which has its own filters) shares the same controls:
- Date range — the reporting window. Defaults to the last 30 days.
- Filter by user — restrict to specific users (admins only). The Tokens tab additionally offers Filter by model and Filter by API key.
- Refresh — re-fetch with the current filters.
- Metric — which value the trend chart and KPI sort use (e.g. GPU Hours vs Instance Hours).
- Group by — split the trend chart into one series per group (e.g. per instance type).
- Granularity — the trend bucket. GPU Instances and Storage support Hour / Day / Week / Month; Tokens supports Day / Week / Month only (token usage is a daily rollup, so it has no hourly bucket).
- Export (download icon, available on Tokens / GPU Instances / Storage) — opens a preview of the current filtered breakdown and lets you download it.
Metric definitions
| Metric | Meaning |
|---|---|
| Input Tokens | Prompt tokens. Input Cached Tokens is the subset served from the prompt cache. |
| Output Tokens | Completion tokens generated. |
| Total Tokens | Input + Output. |
| Instance Hours | Wall-clock instance runtime: Σ(uptime) regardless of how many cards the instance holds. |
| GPU Hours | Accelerator runtime: Σ(uptime × GPU card count). A 2-GPU instance run for 1 hour = 2 GPU Hours but 1 Instance Hour. |
| GB-Days | Provisioned storage over time: capacity (GB) × days held. |
| GB-Hours | Same as GB-Days, expressed per hour. |
| Active Instances / Active Storages / Active Users | Resources that are still live (not Deleted) within the window. |
| Last Active | The most recent bucket in which the resource accrued usage. |
Note
Deleted resources keep their historical usage — a deleted model, instance, or storage still appears in the tables (flagged Deleted) and contributes to the totals, but it is no longer counted as Active.
Summary
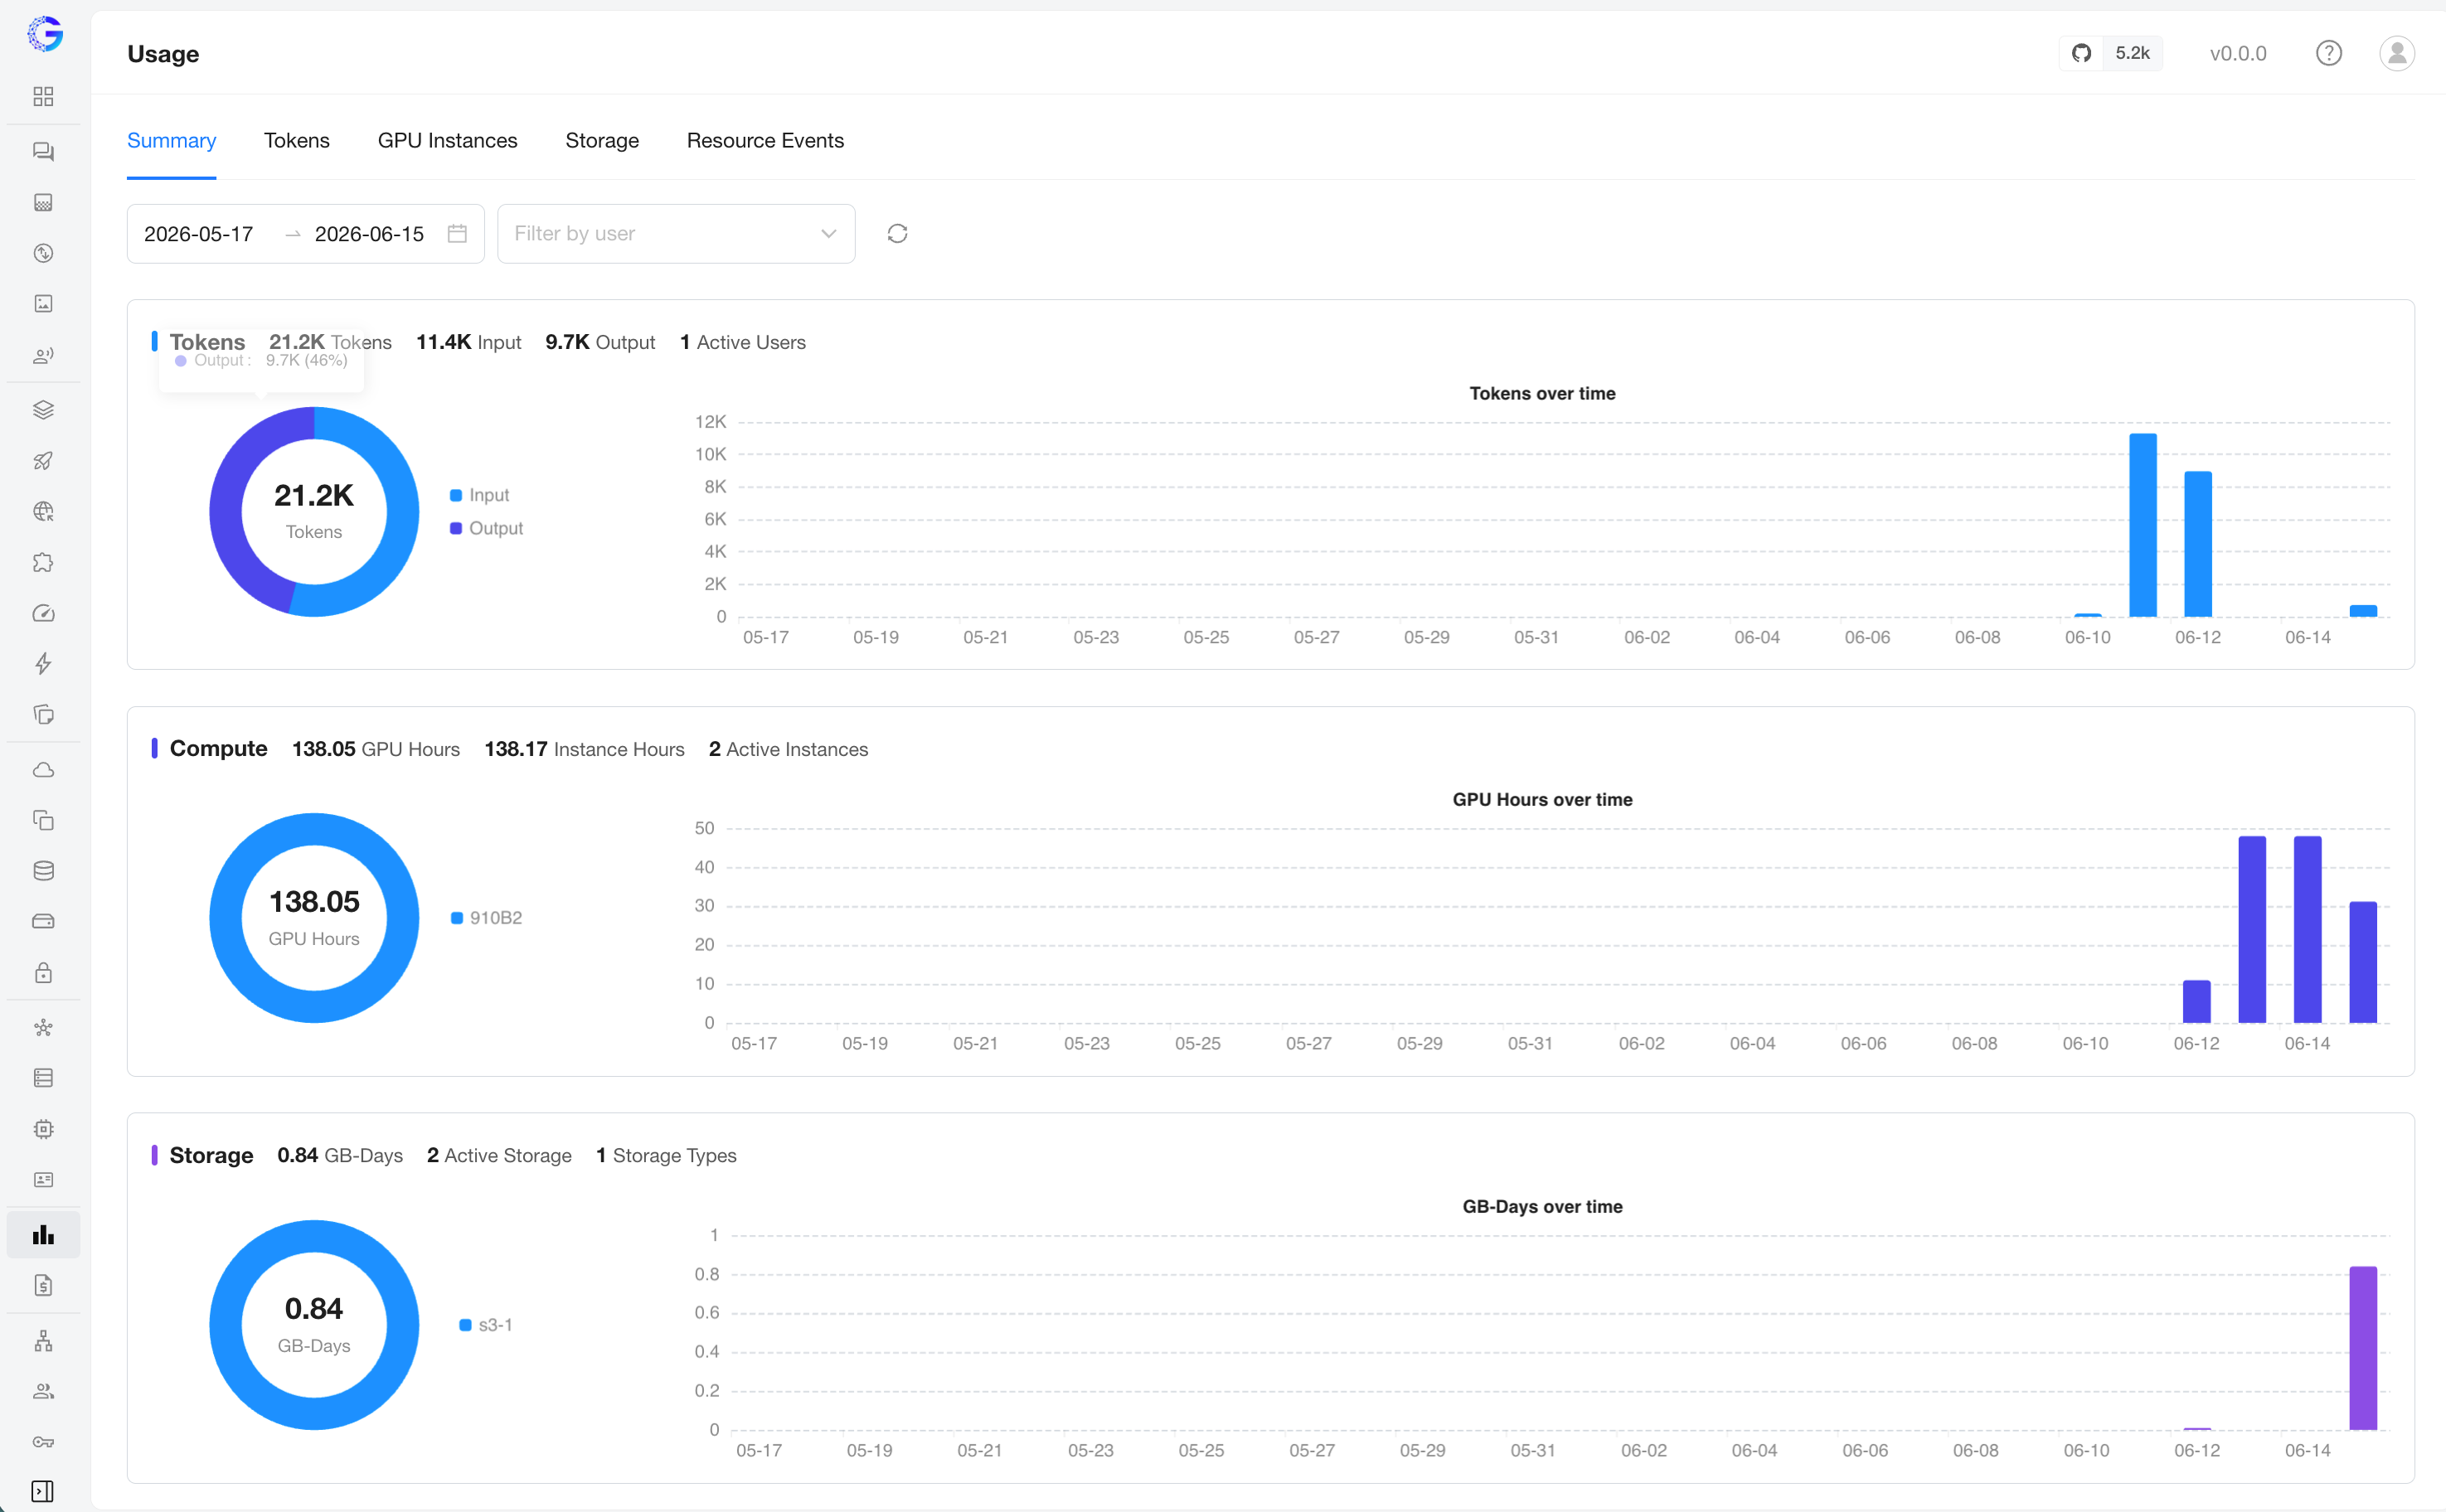
The Summary tab stacks three sections — Tokens, Compute, and Storage. Each shows a headline stat line, a breakdown donut (by type), and a trend chart over the selected range, giving you a quick read across all three resource kinds without switching tabs.
Tokens
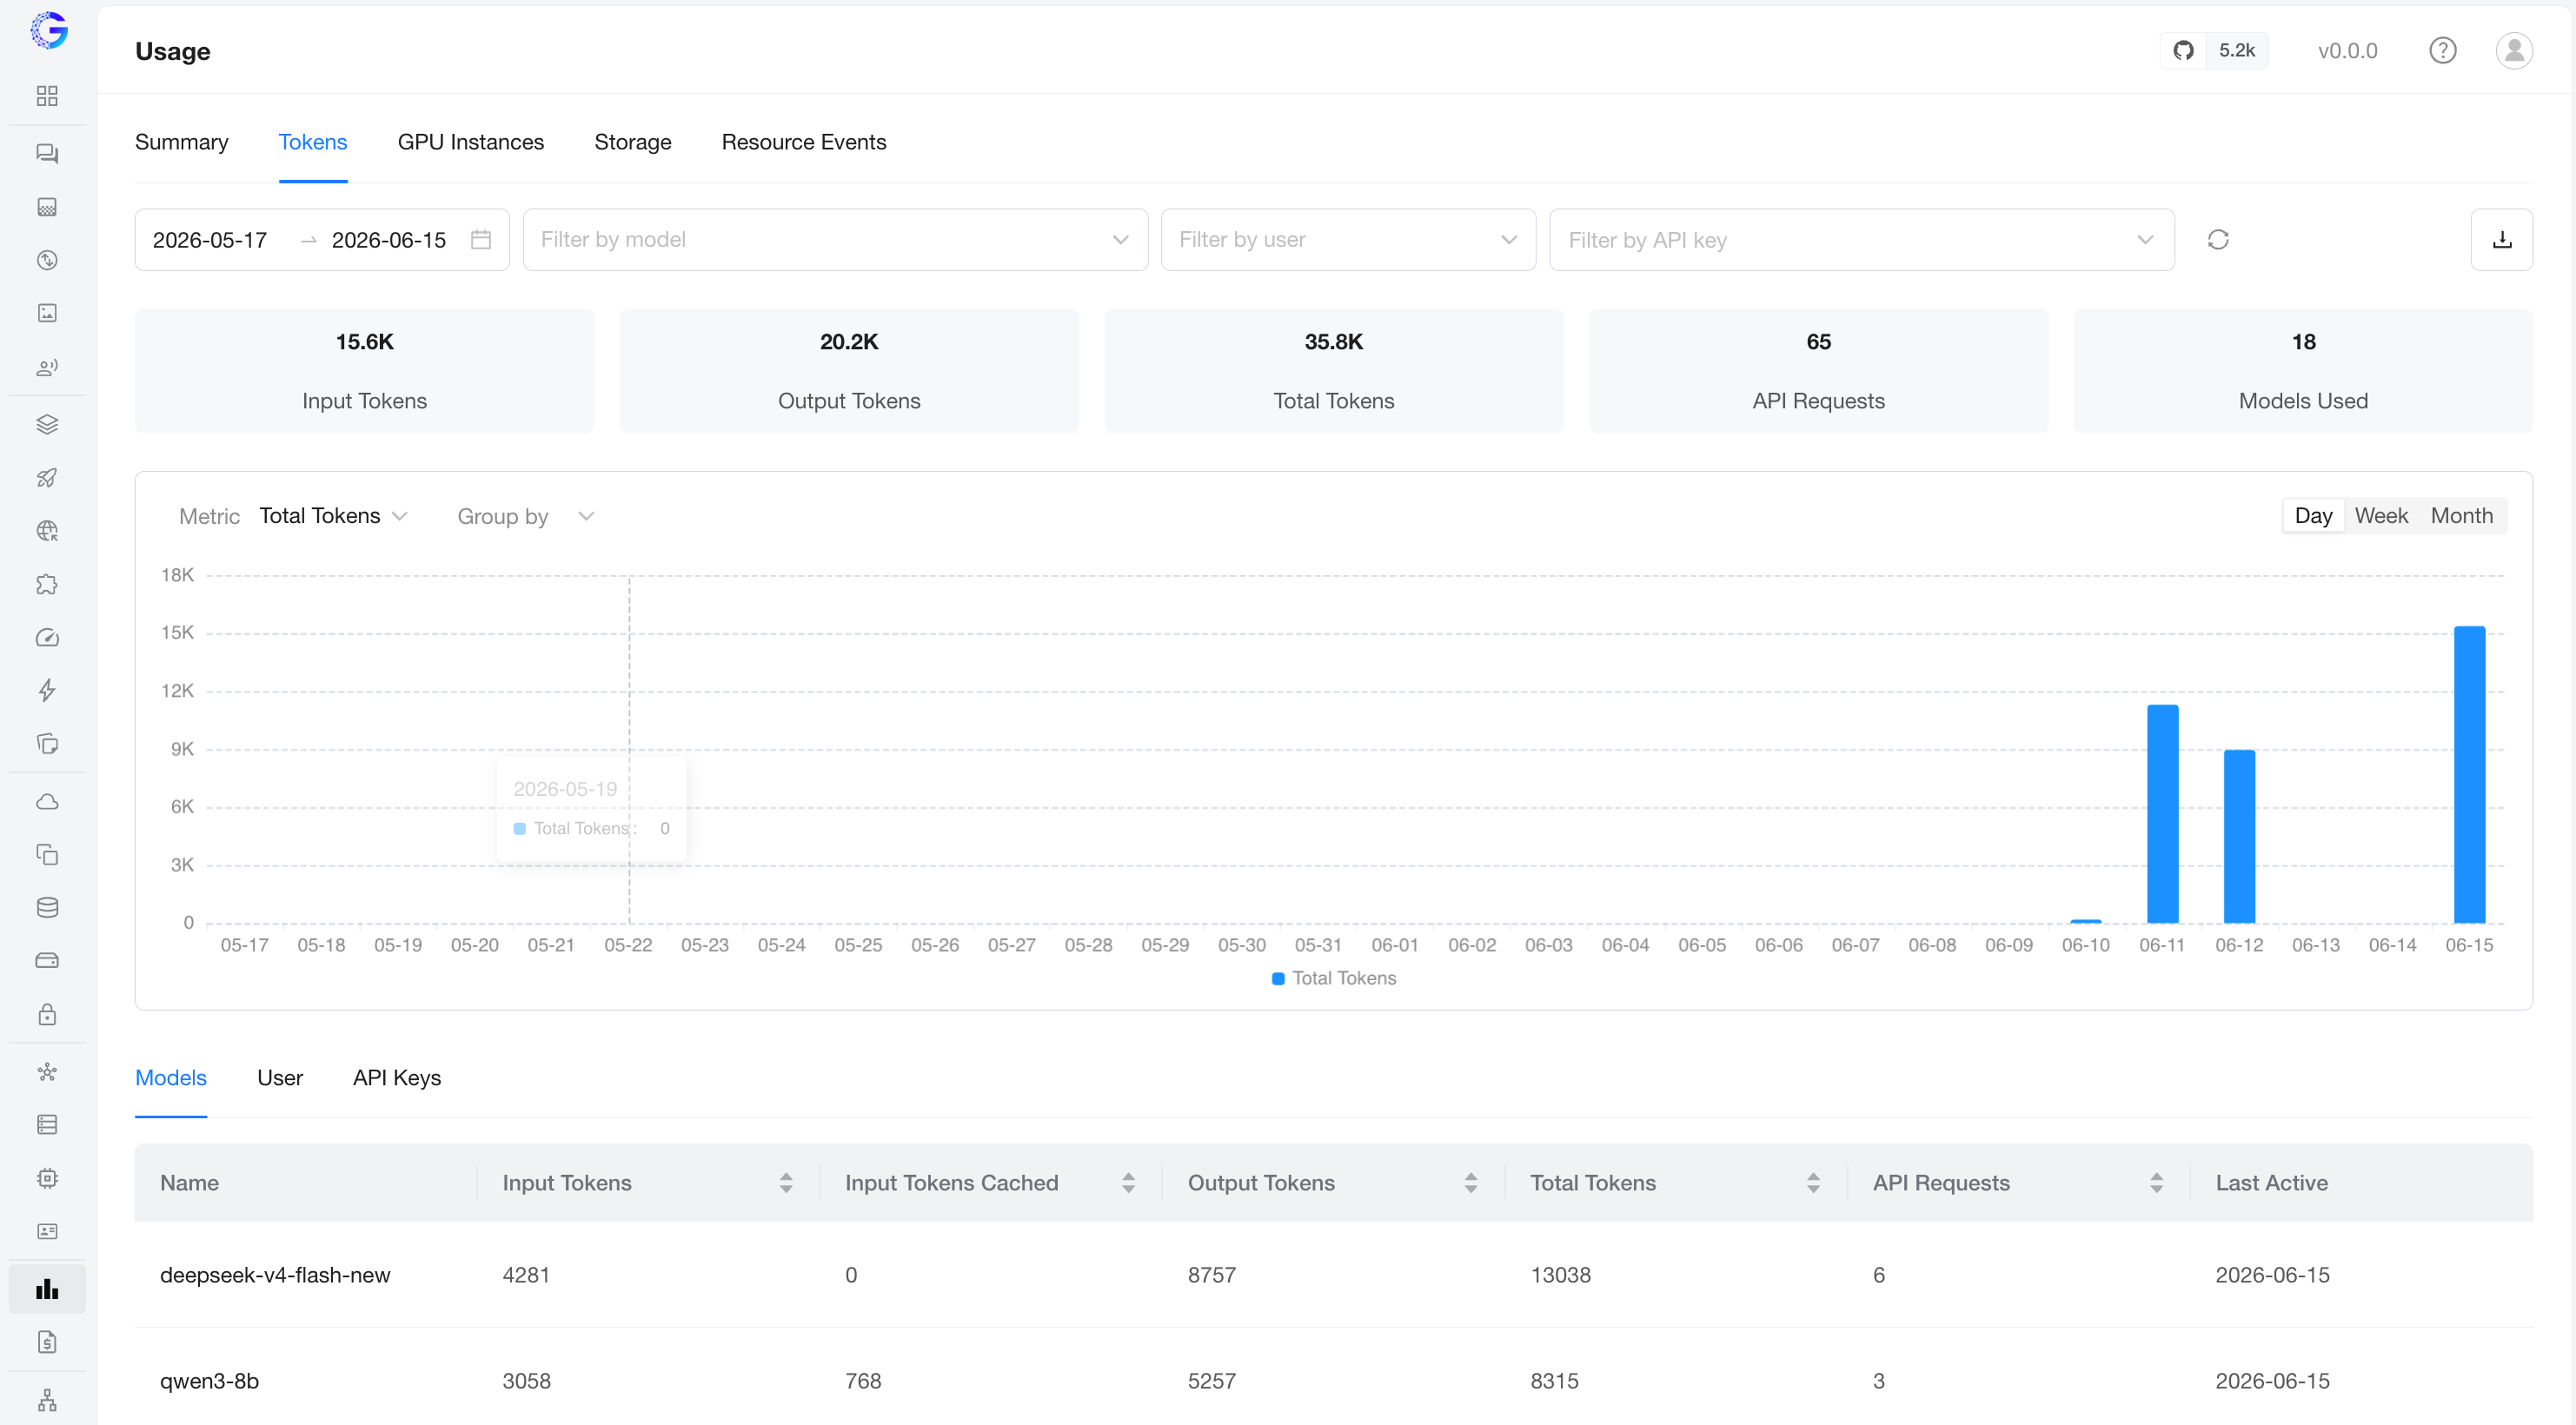
Token consumption from LLM inference. KPIs across the top: Input / Output / Total Tokens, API Requests, and Models Used.
The bottom section groups the detail table three ways:
- Models — per model: Input Tokens / Input Cached Tokens / Output Tokens / Total Tokens, API Requests, Last Active.
- Users — per user (admins only).
- API Keys — per API key.
GPU Instances
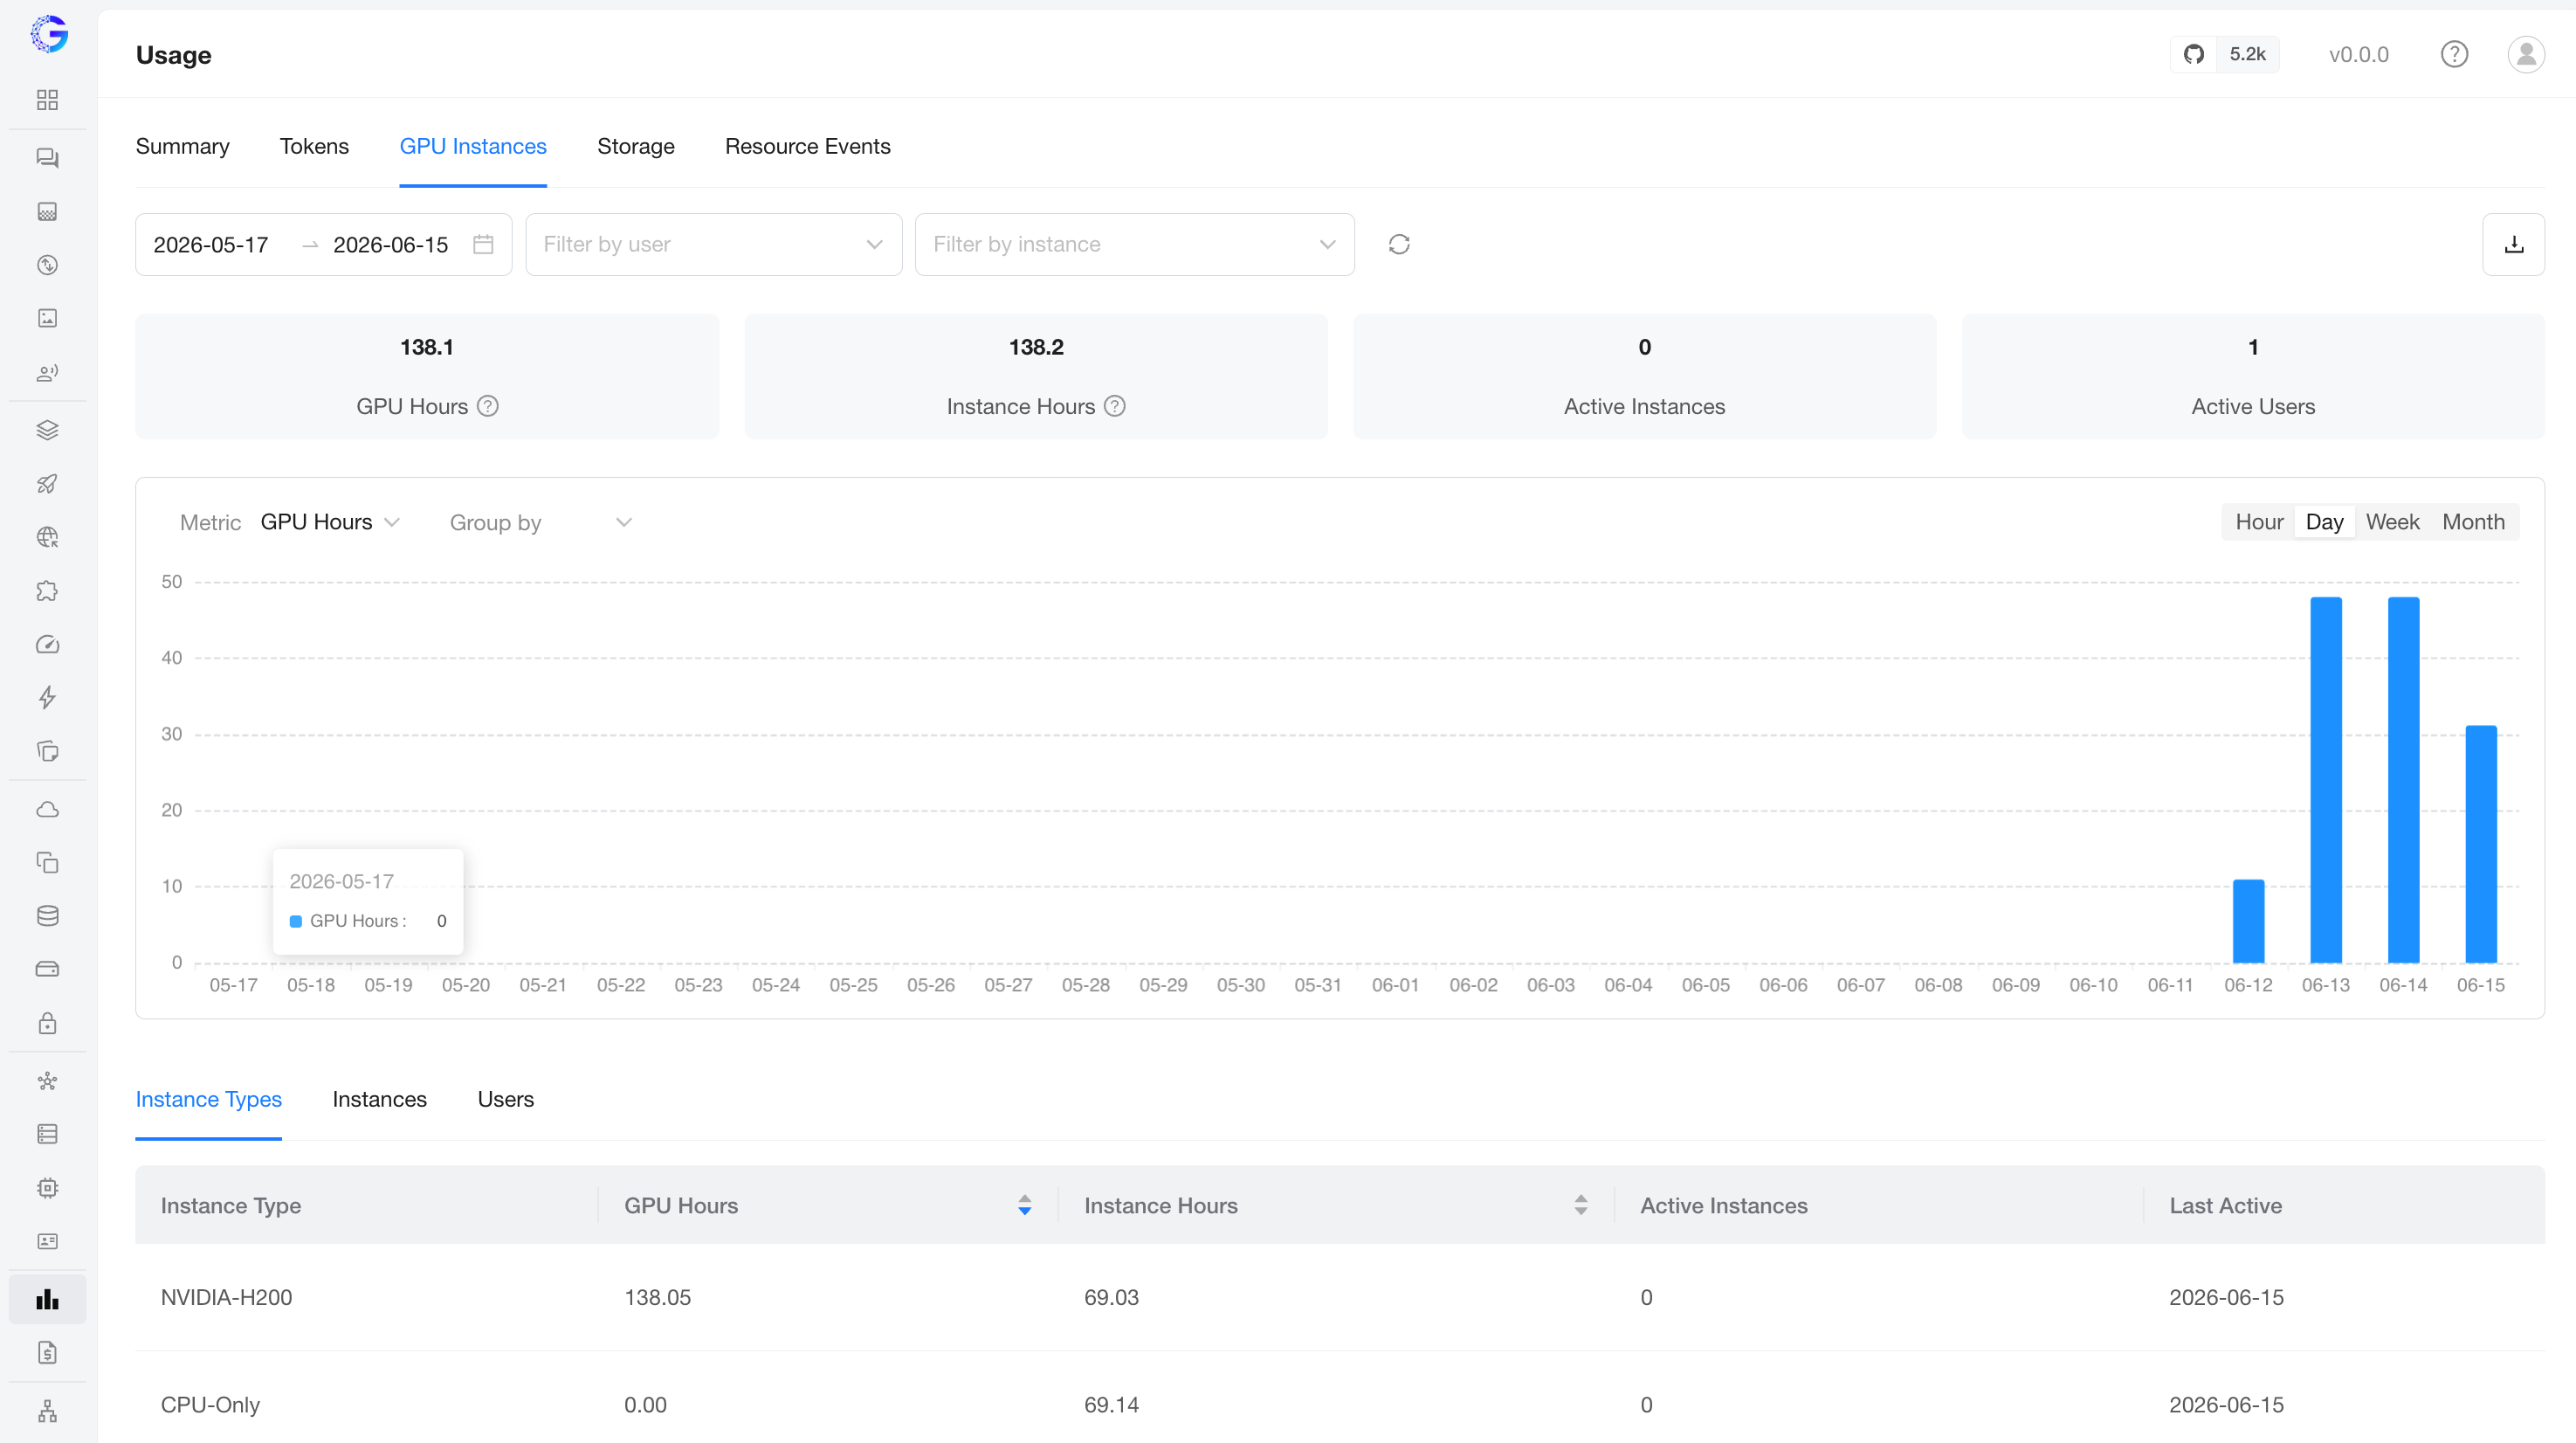
GPU and CPU instance runtime. KPIs: GPU Hours, Instance Hours, Active Instances, Active Users. Choose GPU Hours or Instance Hours as the chart metric, and group the trend by instance type, instance, or user.
The detail table groups by:
- Instance Types — per instance type: GPU Hours, Instance Hours, Active Instances, Last Active.
- Instances — per individual instance.
- Users — per user (admins only).
Note
CPU instances have no accelerator, so they contribute to Instance Hours but not to GPU Hours.
Storage
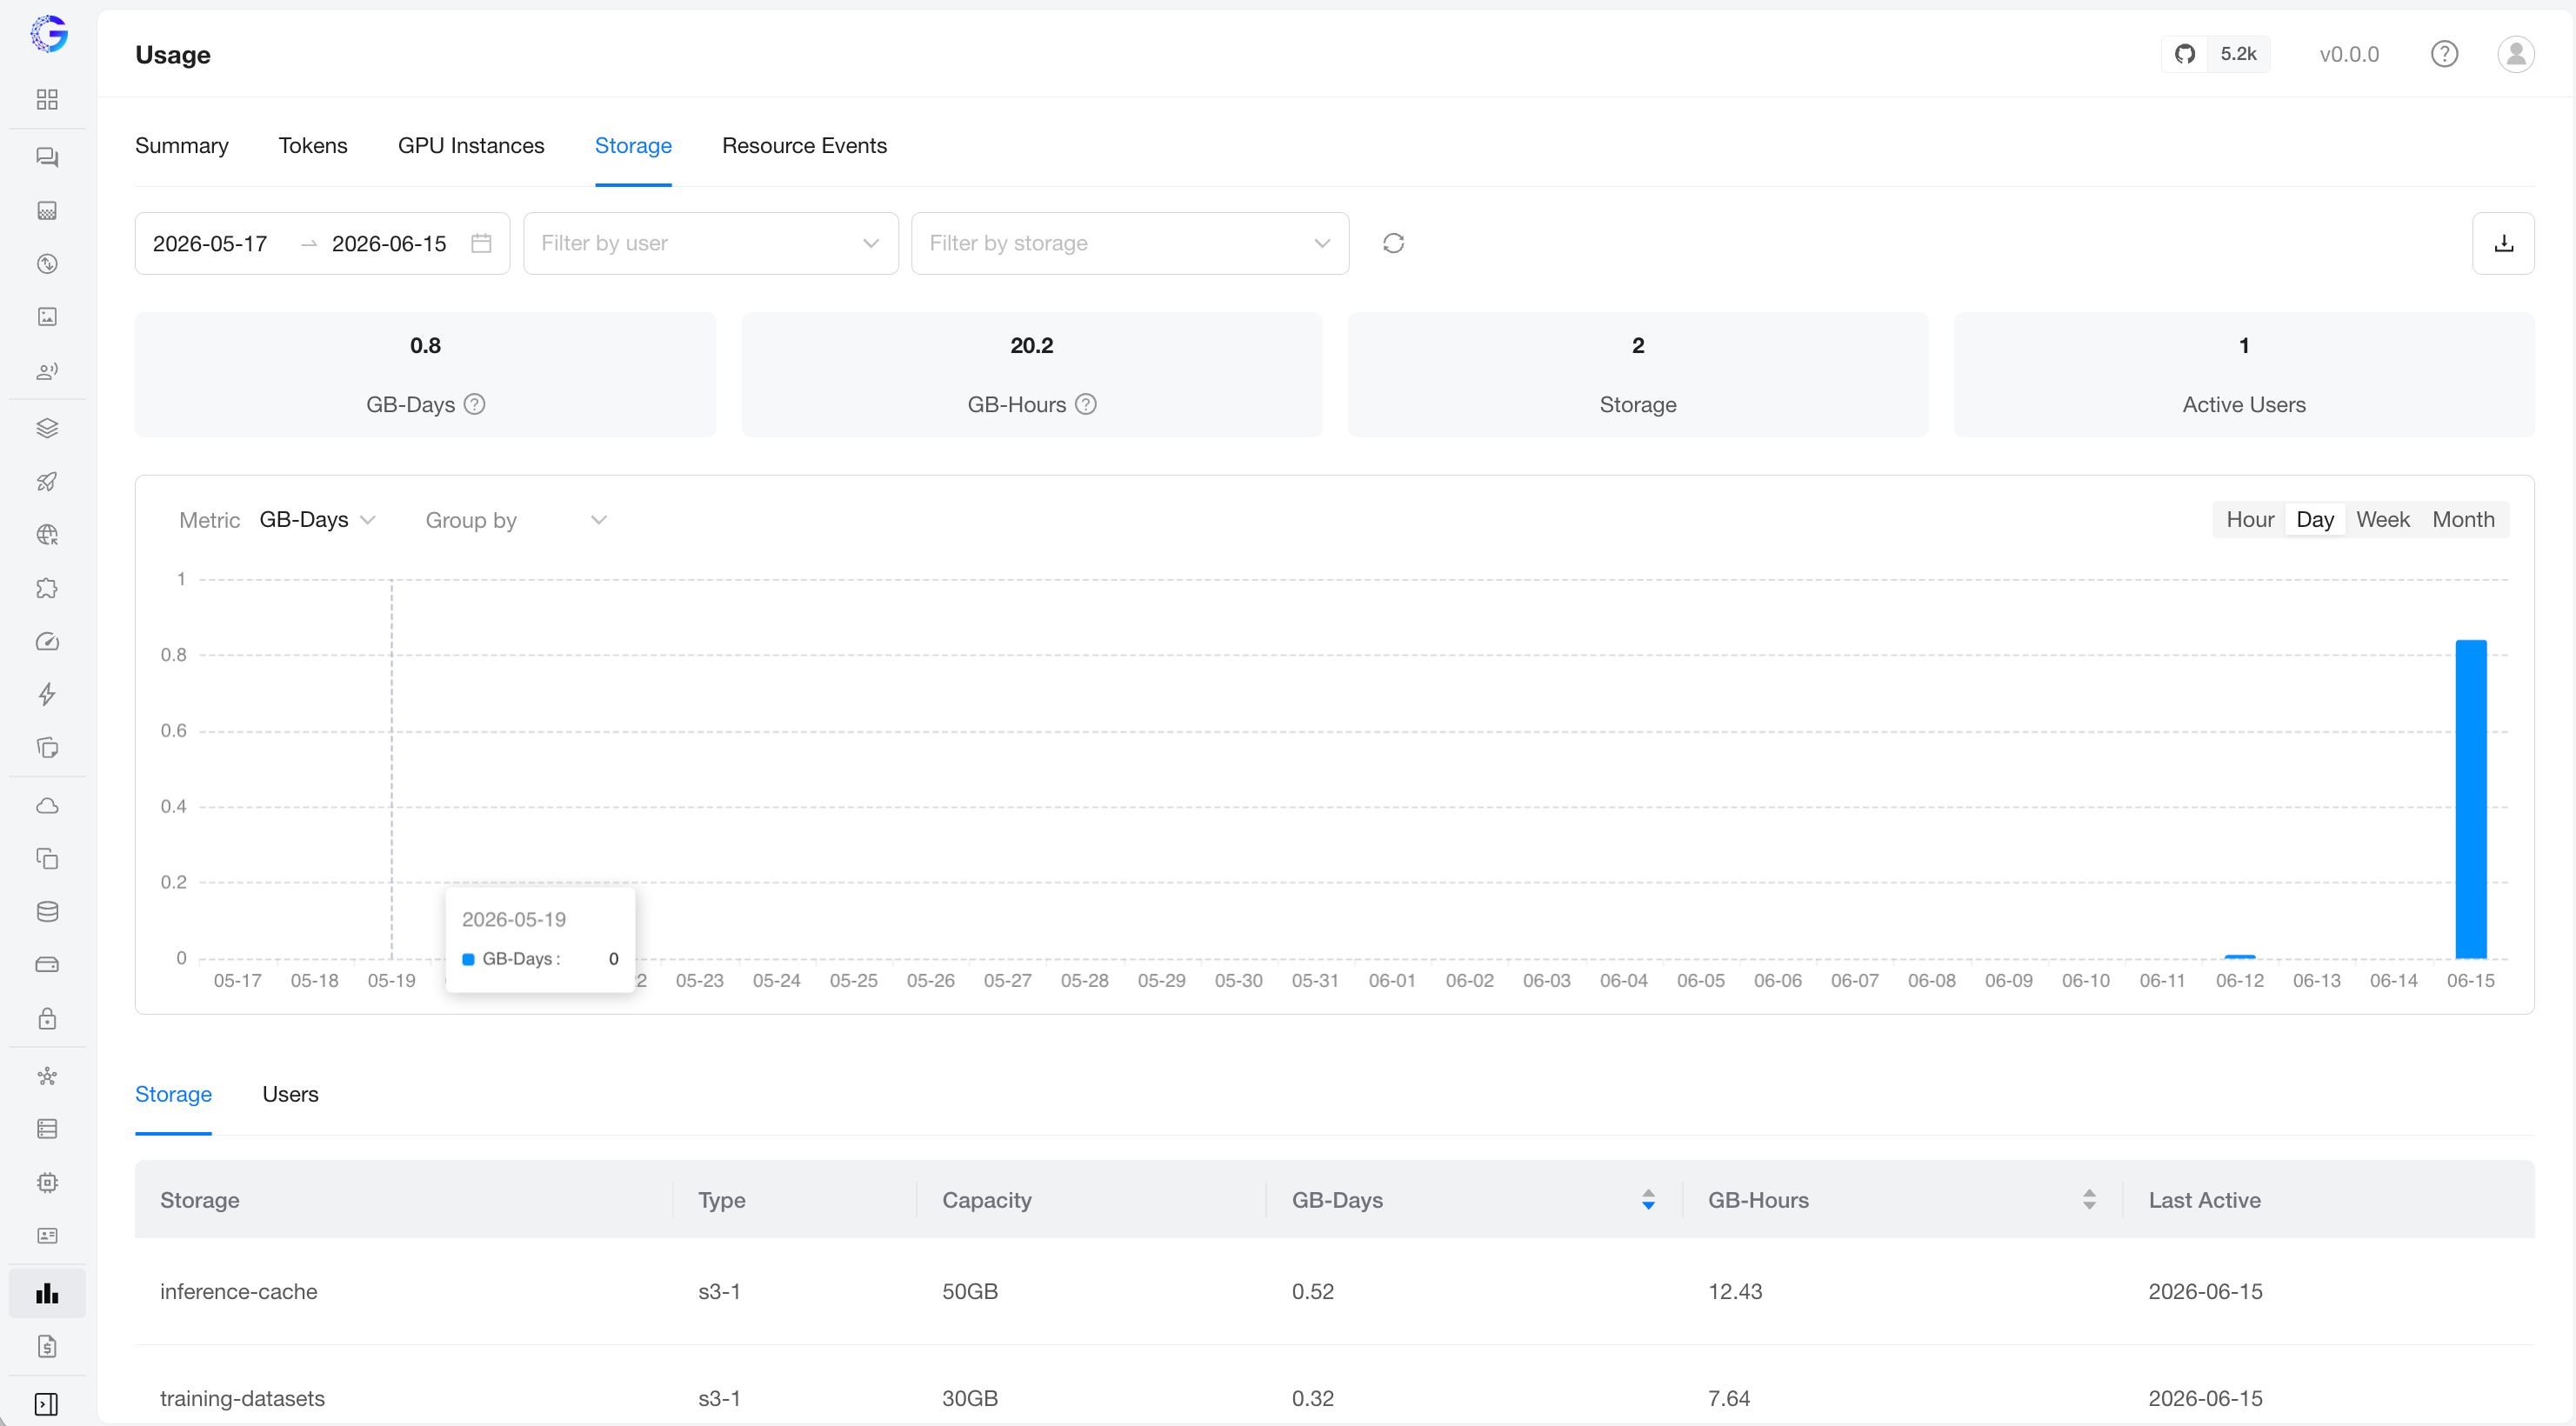
Storage capacity usage. KPIs: GB-Days, GB-Hours, Active Storages, Active Users. Choose GB-Days or GB-Hours as the chart metric and group by storage or user.
The detail table groups by:
- Storage — per volume: Type, Capacity, GB-Days, GB-Hours, Last Active.
- Users — per user (admins only).
Note
Because storage is metered from creation to deletion regardless of attachment, storage that exists but is idle still accrues GB-Days/GB-Hours.
Resource Events
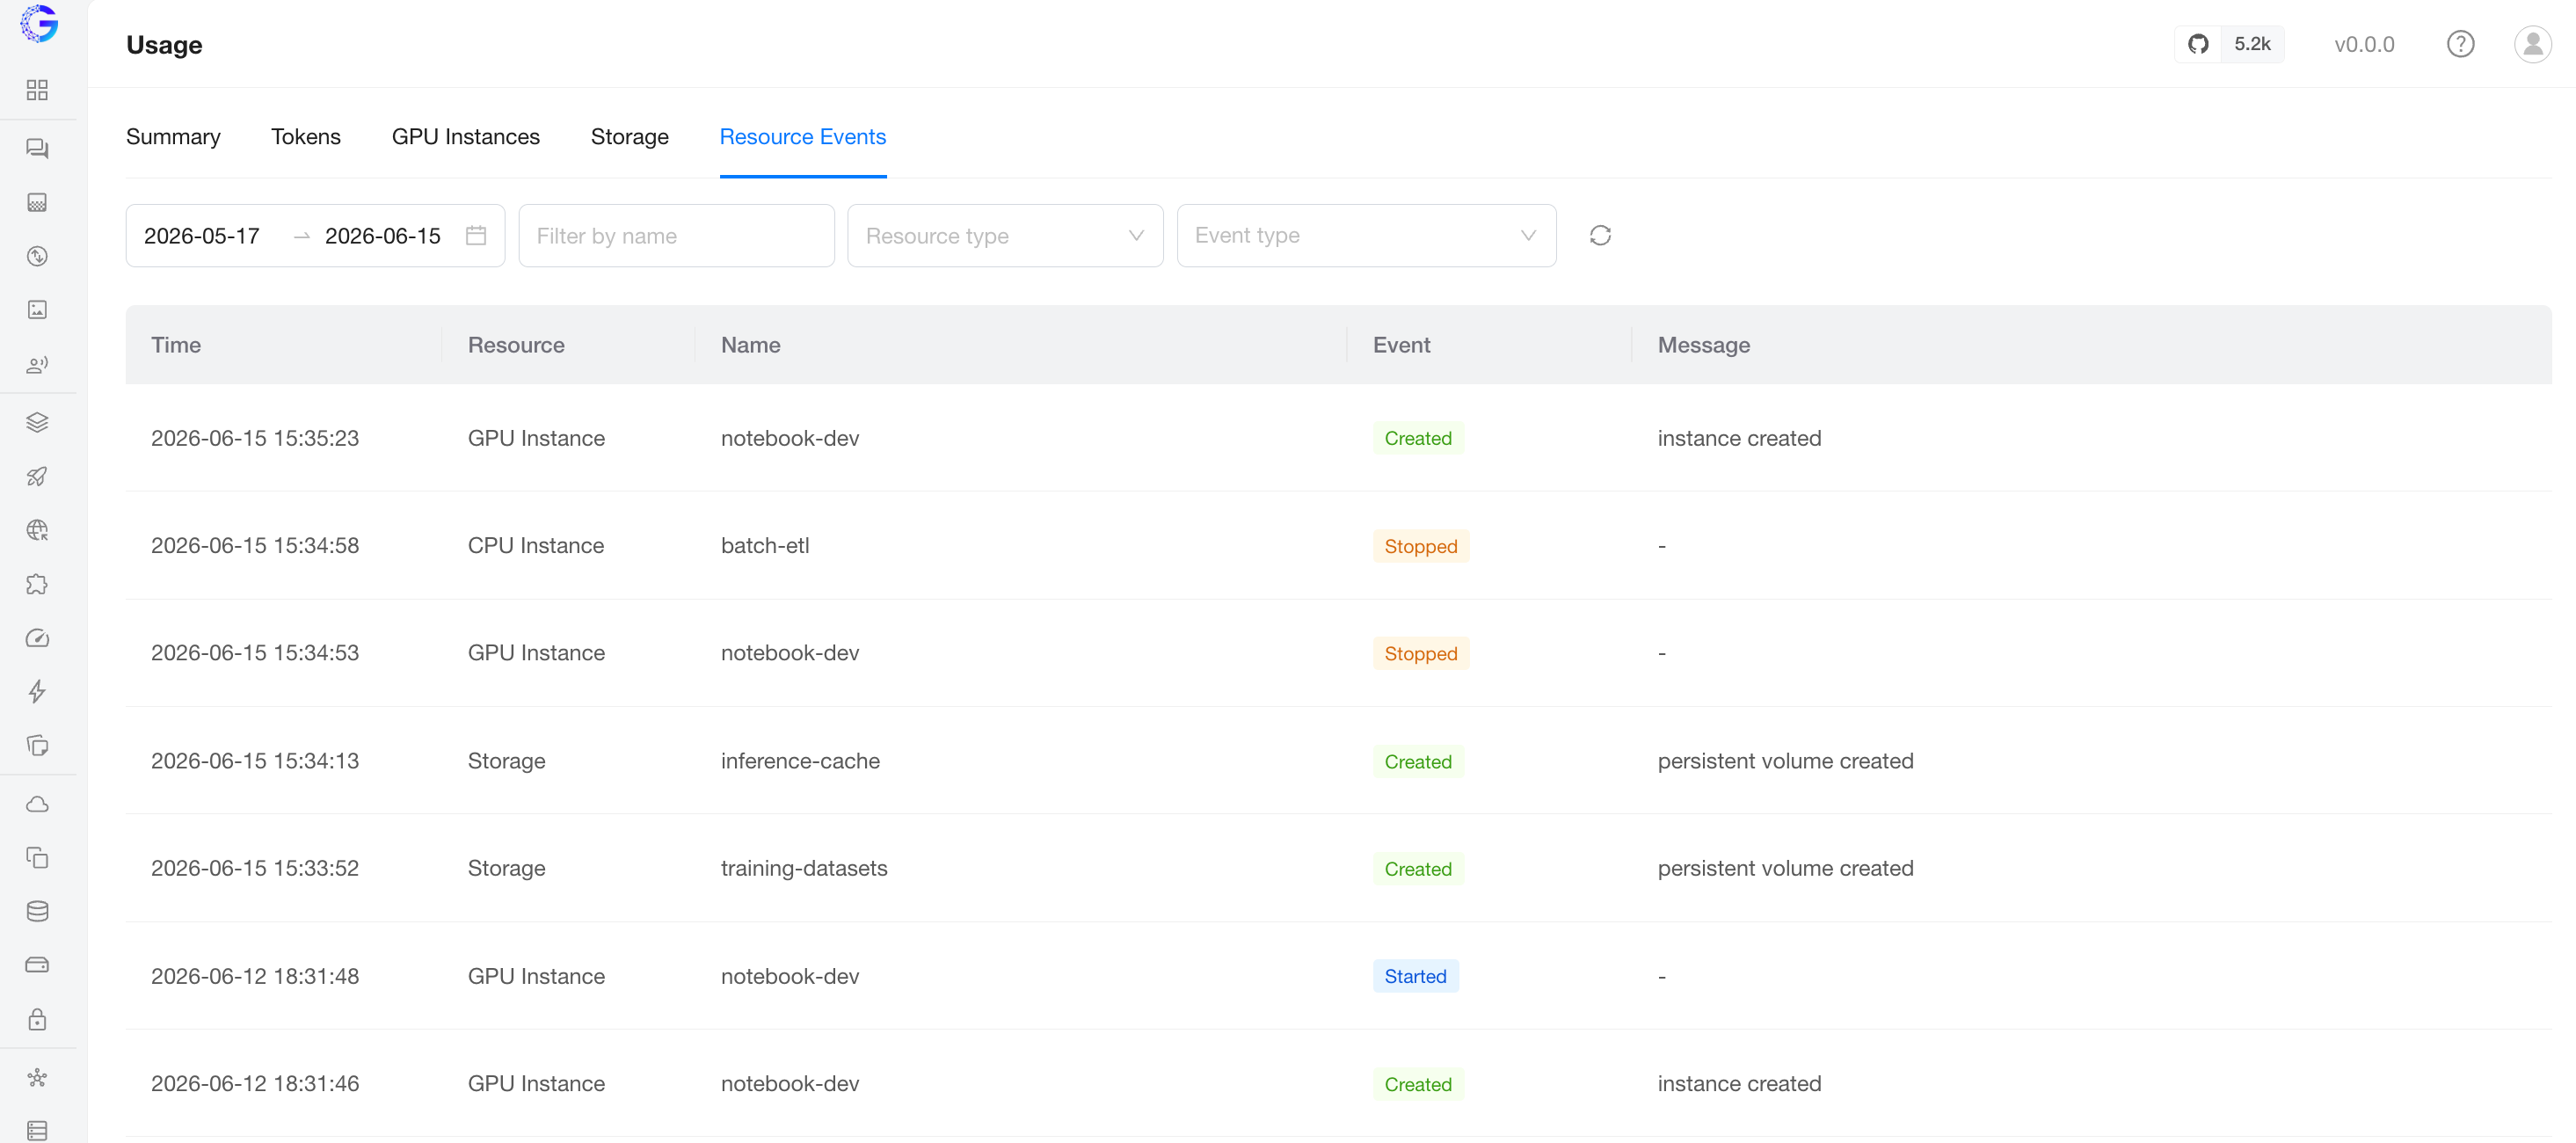
The lifecycle audit log behind the compute and storage numbers — one row per metering-relevant transition. Useful for explaining why a number looks the way it does.
Filters: date range, resource type (GPU Instance / Storage), event type, and a fuzzy resource name search.
Timezone
All dates and times on the Usage page — trend buckets, Last Active, and resource-event times — are shown in a single configurable rollup timezone, so every tab lines up on the same calendar boundaries. It is controlled by the GPUSTACK_TIMEZONE server environment variable (the legacy GPUSTACK_USAGE_ROLLUP_TIMEZONE still works as a deprecated alias) and defaults to the server's OS local timezone. See Environment Variables for details, including the note on Daylight Saving Time.
Data retention
Token, compute, and storage rollups are retained for about 13 months, after which they are moved to archive tables by a background job. Retention windows and archive schedules are configurable via the GPUSTACK_*_RETENTION_MONTHS and GPUSTACK_*_ARCHIVE_CRON environment variables.