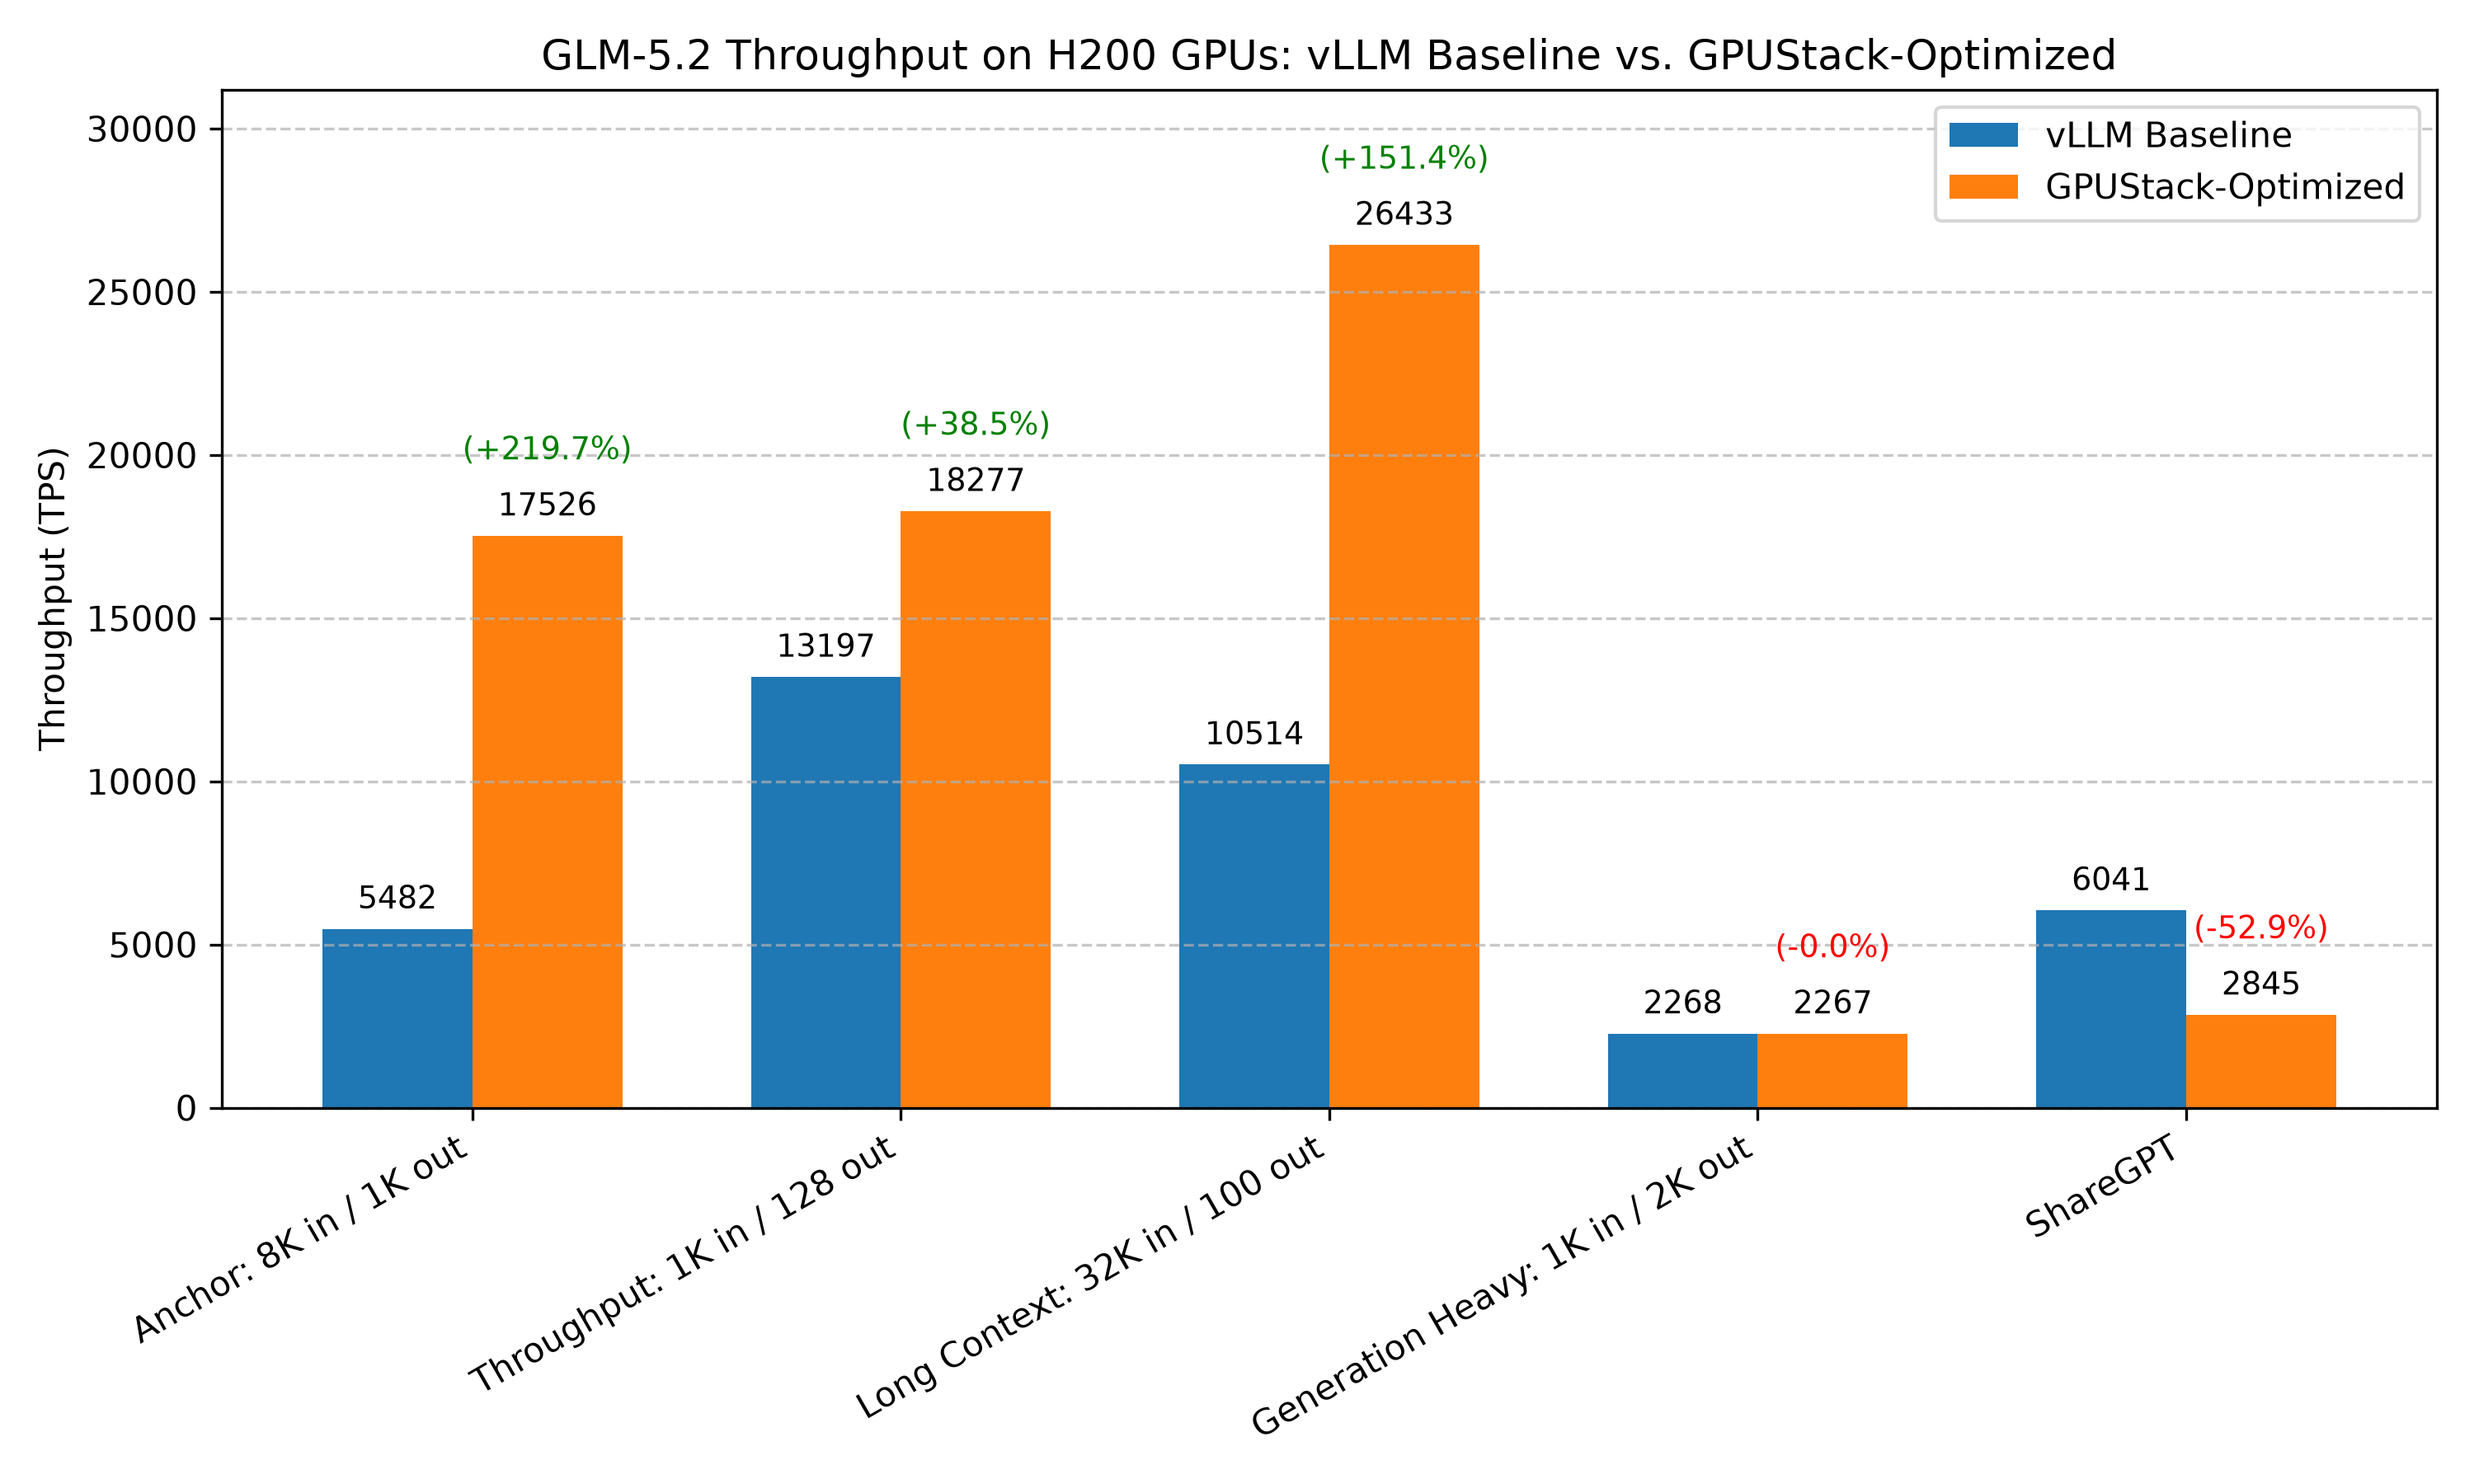
Comparison of benchmark results before and after optimization:
Benchmark Case
baseline (vLLM without any optimizations)
Optimized
Balanced: 8K in / 1K out (optimization target)
Total TPS: 5481.90 Mean TPOT(ms): 636.24
Total TPS: 17525.76 (+219.70%) Mean TPOT(ms): 217.89
Short Context (1K in / 128 out)
Total TPS: 13196.90 Mean TPOT(ms): 316.73
Total TPS: 18276.60 (+38.49%) Mean TPOT(ms): 211.06
Long Context (32K in / 100 out)
Total TPS: 10513.68 Mean TPOT(ms): 1320.02
Total TPS: 26433.15 (+151.42%) Mean TPOT(ms): 537.26
Generation Heavy (1K in / 2K out)
Total TPS: 2268.18 Mean TPOT(ms): 42.11
Total TPS: 2267.33 (-0.04%) Mean TPOT(ms): 46.54
ShareGPT
Total TPS: 6040.94 Mean TPOT(ms): 149.24
Total TPS: 2845.48 (-52.90%) Mean TPOT(ms): 331.21
Note
Our benchmark tests do not cover all possible optimization combinations. For example, we select the inference engine that performs best under its default configuration as the starting point for further tuning. This pruning approach yields a local optimum, which may not be the global optimum.
There are other optimization methods that depend on specific user scenarios, including max batch size, schedule configuration, extended KV cache, CUDA graph, etc. The conclusions in this document can serve as a starting point for more targeted optimizations.
The tests are conducted on specific hardware and software setups. Advances in the inference engine may lead to new conclusions.
Although using quantization may impact accuracy. FP8 quantization can achieve less than 1% accuracy drop for most models. See the evaluation results for more details. Therefore, it is highly recommended to use FP8 quantization for low-latency serving scenarios.
The recommended configuration is tuned for high-concurrency, medium-to-long input (the anchor 8K in / 1K out workload). On short input/output conversational workloads such as ShareGPT it regresses versus plain tensor parallelism, because the DP-attention and DeepEP optimizations are designed for long sequences and their overhead is not amortized by short requests (see ShareGPT under Other Benchmark Cases). This trade-off suits GLM-5.2's target use case: its strong coding ability makes coding-agent serving the primary scenario, where context is predominantly long — exactly the regime this configuration is optimized for.
If there are any missing points or updates reflecting new changes, please let us know.
Experimental Setup
Model
zai-org/GLM-5.2-FP8
Hardware
NVIDIA H200x8
Engine Version
vLLM v0.24.0
SGLang v0.5.14
Benchmark Method
This project uses GPUStack's one-click benchmark capability for serving workloads. The benchmark tests in this document were executed with that workflow.
GPUStack's benchmark implementation is built on top of guidellm via the wrapper project benchmark-runner.
GPUStack handles model deployment, benchmark job submission, and result collection for the benchmark configurations listed below.
============ Serving Benchmark Result ============
Successful requests:                     1000
Maximum request concurrency:             512
Benchmark duration (s):                  1425.58
Total input tokens:                      8204000
Total generated tokens:                  1024000
Request throughput (req/s):              0.70
Output token throughput (tok/s):         719.90
Peak output token throughput (tok/s):    36770.60
Peak concurrent requests:                512.00
Total Token throughput (tok/s):          6487.53
----------------------Latency---------------------
Mean Latency(s):                          553.77
Median Latency(s):                        674.98
P95 Latency(s):                           738.28
P99 Latency(s):                           1087.06
---------------Time to First Token----------------
Mean TTFT (ms):                          499353.08
Median TTFT (ms):                        640537.31
P95 TTFT (ms):                           692823.09
P99 TTFT (ms):                           694859.54
-----Time per Output Token (excl. 1st token)------
Mean TPOT (ms):                          540.79
Median TPOT (ms):                        659.16
P95 TPOT (ms):                           720.97
P99 TPOT (ms):                           1061.58
---------------Inter-token Latency----------------
Mean ITL (ms):                           53.19
Median ITL (ms):                         41.87
P95 ITL (ms):                            53.14
P99 ITL (ms):                            661.38
==================================================
Summary: SGLang Total TPS = 6487.53, vLLM Total TPS = 5481.90. SGLang is faster by 1005.62 tok/s (18.34%); Mean TPOT = 540.79 ms vs 636.24 ms, reduced by 95.45 ms (15.00%).
============ Serving Benchmark Result ============
Successful requests:                     1000
Maximum request concurrency:             512
Benchmark duration (s):                  1430.76
Total input tokens:                      8204000
Total generated tokens:                  1024000
Request throughput (req/s):              0.70
Output token throughput (tok/s):         724.90
Peak output token throughput (tok/s):    36964.00
Peak concurrent requests:                512.00
Total Token throughput (tok/s):          6532.56
----------------------Latency---------------------
Mean Latency(s):                          546.29
Median Latency(s):                        710.24
P95 Latency(s):                           716.16
P99 Latency(s):                           716.23
---------------Time to First Token----------------
Mean TTFT (ms):                          509145.51
Median TTFT (ms):                        672291.77
P95 TTFT (ms):                           682441.07
P99 TTFT (ms):                           682611.26
-----Time per Output Token (excl. 1st token)------
Mean TPOT (ms):                          533.49
Median TPOT (ms):                        693.59
P95 TPOT (ms):                           699.37
P99 TPOT (ms):                           699.44
---------------Inter-token Latency----------------
Mean ITL (ms):                           36.31
Median ITL (ms):                         35.36
P95 ITL (ms):                            40.52
P99 ITL (ms):                            40.69
==================================================
Summary: TP + DP + DP-Attention Total TPS = 7011.17, TP + DP-Attention Total TPS = 6371.59. TP + DP + DP-Attention is faster by 639.58 tok/s (10.04%); Mean TPOT = 497.48 ms vs 553.48 ms, reduced by 56.00 ms (10.12%).
============ Serving Benchmark Result ============
Successful requests:                     1000
Maximum request concurrency:             512
Benchmark duration (s):                  688.60
Total input tokens:                      8204000
Total generated tokens:                  1024000
Request throughput (req/s):              1.45
Output token throughput (tok/s):         1527.01
Peak output token throughput (tok/s):    46500.08
Peak concurrent requests:                512.00
Total Token throughput (tok/s):          13760.98
----------------------Latency---------------------
Mean Latency(s):                          273.29
Median Latency(s):                        272.67
P95 Latency(s):                           362.52
P99 Latency(s):                           488.73
---------------Time to First Token----------------
Mean TTFT (ms):                          201642.60
Median TTFT (ms):                        219374.83
P95 TTFT (ms):                           293139.84
P99 TTFT (ms):                           297529.93
-----Time per Output Token (excl. 1st token)------
Mean TPOT (ms):                          266.89
Median TPOT (ms):                        266.28
P95 TPOT (ms):                           354.02
P99 TPOT (ms):                           477.28
---------------Inter-token Latency----------------
Mean ITL (ms):                           70.04
Median ITL (ms):                         65.72
P95 ITL (ms):                            85.73
P99 ITL (ms):                            276.51
==================================================
Summary: 0.85 Total TPS = 13760.98, auto Total TPS = 5881.79. 0.85 is faster by 7879.19 tok/s (133.96%); Mean TPOT = 266.89 ms vs 594.26 ms, reduced by 327.38 ms (55.09%).
============ Serving Benchmark Result ============
Successful requests:                     1000
Maximum request concurrency:             512
Benchmark duration (s):                  689.11
Total input tokens:                      8204000
Total generated tokens:                  1024000
Request throughput (req/s):              1.45
Output token throughput (tok/s):         1526.75
Peak output token throughput (tok/s):    52394.68
Peak concurrent requests:                512.00
Total Token throughput (tok/s):          13758.60
----------------------Latency---------------------
Mean Latency(s):                          273.27
Median Latency(s):                        272.75
P95 Latency(s):                           362.79
P99 Latency(s):                           489.22
---------------Time to First Token----------------
Mean TTFT (ms):                          201640.48
Median TTFT (ms):                        219319.19
P95 TTFT (ms):                           293076.86
P99 TTFT (ms):                           297429.96
-----Time per Output Token (excl. 1st token)------
Mean TPOT (ms):                          266.86
Median TPOT (ms):                        266.36
P95 TPOT (ms):                           354.28
P99 TPOT (ms):                           477.76
---------------Inter-token Latency----------------
Mean ITL (ms):                           70.02
Median ITL (ms):                         65.70
P95 ITL (ms):                            85.80
P99 ITL (ms):                            276.29
==================================================
Summary: default Total TPS = 13760.98, 8K Total TPS = 13758.60. default is faster by 2.37 tok/s (0.02%); Mean TPOT = 266.89 ms vs 266.86 ms, increased by 0.03 ms (0.01% slower).
Larger chunked-prefill sizes OOM
Setting --chunked-prefill-size to 16384 or 32768 crashes with an out-of-memory error on this configuration: a larger chunked-prefill size raises the activation reserve, which the memory planner subtracts from the KV-cache budget, leaving too little for the ~700B FP8 weights plus KV cache. Only 8192 (and the default) run, and they are within noise of each other. Chunked-prefill size offers no throughput benefit at 8K input and is left at its default in the recommended configuration.
============ Serving Benchmark Result ============
Successful requests:                     1000
Maximum request concurrency:             512
Benchmark duration (s):                  666.14
Total input tokens:                      8204000
Total generated tokens:                  1024000
Request throughput (req/s):              1.50
Output token throughput (tok/s):         1581.39
Peak output token throughput (tok/s):    38164.10
Peak concurrent requests:                512.00
Total Token throughput (tok/s):          14251.08
----------------------Latency---------------------
Mean Latency(s):                          265.47
Median Latency(s):                        292.45
P95 Latency(s):                           368.40
P99 Latency(s):                           482.40
---------------Time to First Token----------------
Mean TTFT (ms):                          203755.52
Median TTFT (ms):                        239495.62
P95 TTFT (ms):                           301525.04
P99 TTFT (ms):                           304478.79
-----Time per Output Token (excl. 1st token)------
Mean TPOT (ms):                          259.25
Median TPOT (ms):                        285.59
P95 TPOT (ms):                           359.76
P99 TPOT (ms):                           471.09
---------------Inter-token Latency----------------
Mean ITL (ms):                           60.33
Median ITL (ms):                         54.22
P95 ITL (ms):                            70.59
P99 ITL (ms):                            291.22
==================================================
Summary: max-running 256 Total TPS = 14451.05, max-running 64 Total TPS = 9959.18. max-running 256 is faster by 4491.87 tok/s (45.10%); Mean TPOT = 255.63 ms vs 359.30 ms, reduced by 103.67 ms (28.85%).
============ Serving Benchmark Result ============
Successful requests:                     1000
Maximum request concurrency:             512
Benchmark duration (s):                  2722.41
Total input tokens:                      8204000
Total generated tokens:                  1024000
Request throughput (req/s):              0.37
Output token throughput (tok/s):         378.79
Peak output token throughput (tok/s):    63639.56
Peak concurrent requests:                512.00
Total Token throughput (tok/s):          3413.56
----------------------Latency---------------------
Mean Latency(s):                          1084.11
Median Latency(s):                        1206.16
P95 Latency(s):                           1510.02
P99 Latency(s):                           1897.83
---------------Time to First Token----------------
Mean TTFT (ms):                          773983.92
Median TTFT (ms):                        924140.14
P95 TTFT (ms):                           1214572.96
P99 TTFT (ms):                           1217017.99
-----Time per Output Token (excl. 1st token)------
Mean TPOT (ms):                          1058.70
Median TPOT (ms):                        1177.89
P95 TPOT (ms):                           1474.63
P99 TPOT (ms):                           1853.35
---------------Inter-token Latency----------------
Mean ITL (ms):                           303.15
Median ITL (ms):                         277.82
P95 ITL (ms):                            294.11
P99 ITL (ms):                            1229.38
==================================================
Summary: auto Total TPS = 14451.05, normal Total TPS = 3413.56. auto is faster by 11037.49 tok/s (323.34%); Mean TPOT = 255.63 ms vs 1058.70 ms, reduced by 803.07 ms (75.85%).
============ Serving Benchmark Result ============
Successful requests:                     1000
Maximum request concurrency:             512
Benchmark duration (s):                  539.39
Total input tokens:                      8204000
Total generated tokens:                  1024000
Request throughput (req/s):              1.85
Output token throughput (tok/s):         1944.77
Peak output token throughput (tok/s):    60301.69
Peak concurrent requests:                512.00
Total Token throughput (tok/s):          17525.76
----------------------Latency---------------------
Mean Latency(s):                          223.12
Median Latency(s):                        219.64
P95 Latency(s):                           327.25
P99 Latency(s):                           327.80
---------------Time to First Token----------------
Mean TTFT (ms):                          143076.43
Median TTFT (ms):                        151142.06
P95 TTFT (ms):                           234645.47
P99 TTFT (ms):                           239552.62
-----Time per Output Token (excl. 1st token)------
Mean TPOT (ms):                          217.89
Median TPOT (ms):                        214.49
P95 TPOT (ms):                           319.58
P99 TPOT (ms):                           320.12
---------------Inter-token Latency----------------
Mean ITL (ms):                           78.24
Median ITL (ms):                         74.83
P95 ITL (ms):                            105.11
P99 ITL (ms):                            217.21
==================================================
Summary: fp8_e4m3 Total TPS = 17525.76, bf16 Total TPS = 14451.05. fp8_e4m3 is faster by 3074.72 tok/s (21.28%); Mean TPOT = 217.89 ms vs 255.63 ms, reduced by 37.74 ms (14.76%).
FP8 KV cache accuracy check (GSM8K)
FP8 KV cache is not the default on Hopper (SGLang auto-selects bf16); it improves throughput only in the KV-bound (high-concurrency, long-context) regime. To confirm it does not degrade quality, we ran a GSM8K sanity check (200 examples, thinking off, greedy):
KV dtype
GSM8K score
bf16
0.975
fp8_e4m3
0.980
The difference is within noise (~1 question / 200), i.e. no measurable accuracy degradation. Still, validate accuracy for your own workload — especially long-context, where FP8 quantization error can accumulate.
Summary of Optimization Options
Benchmark Cases
Optimized
Baseline
Choosing the Inference Engine
Total TPS: 6487.53 (+18.34%) Mean TPOT(ms): 540.79
Total TPS: 5481.90 Mean TPOT(ms): 636.24
Parallel Strategy
Total TPS: 7011.17 (+27.90%) Mean TPOT(ms): 497.48
Total TPS: 5481.90 Mean TPOT(ms): 636.24
Memory Fraction
Total TPS: 13760.98 (+151.03%) Mean TPOT(ms): 266.89
Total TPS: 5481.90 Mean TPOT(ms): 636.24
Chunked Prefill Size
Total TPS: 13760.98 (+151.03%) Mean TPOT(ms): 266.89
Total TPS: 5481.90 Mean TPOT(ms): 636.24
DeepEP + Max Running Requests
Total TPS: 14451.05 (+163.61%) Mean TPOT(ms): 255.63
Total TPS: 5481.90 Mean TPOT(ms): 636.24
DeepEP Mode
Total TPS: 14451.05 (+163.61%) Mean TPOT(ms): 255.63
Total TPS: 5481.90 Mean TPOT(ms): 636.24
KV Cache DType
Total TPS: 17525.76 (+219.70%) Mean TPOT(ms): 217.89